ABOUT SFSC

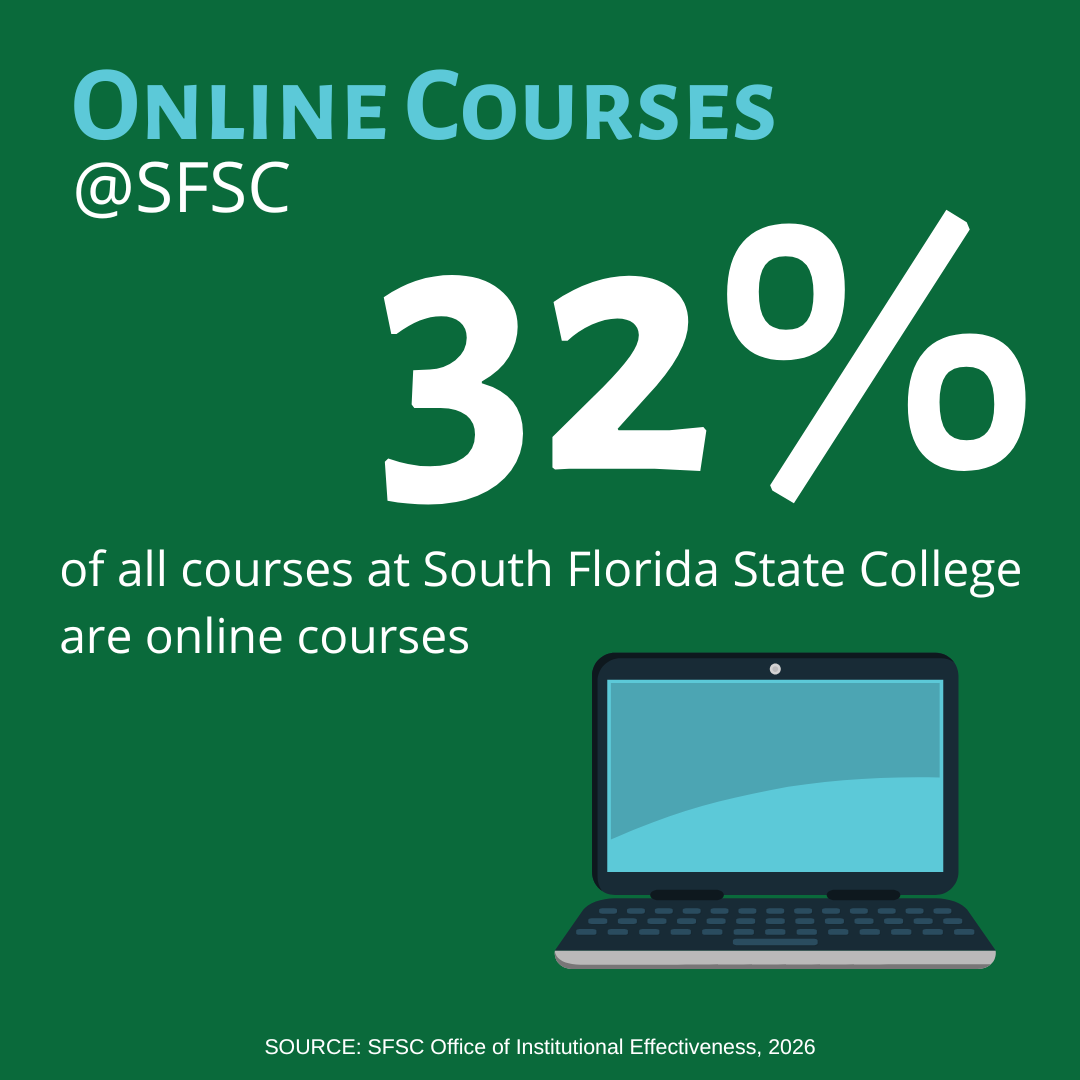
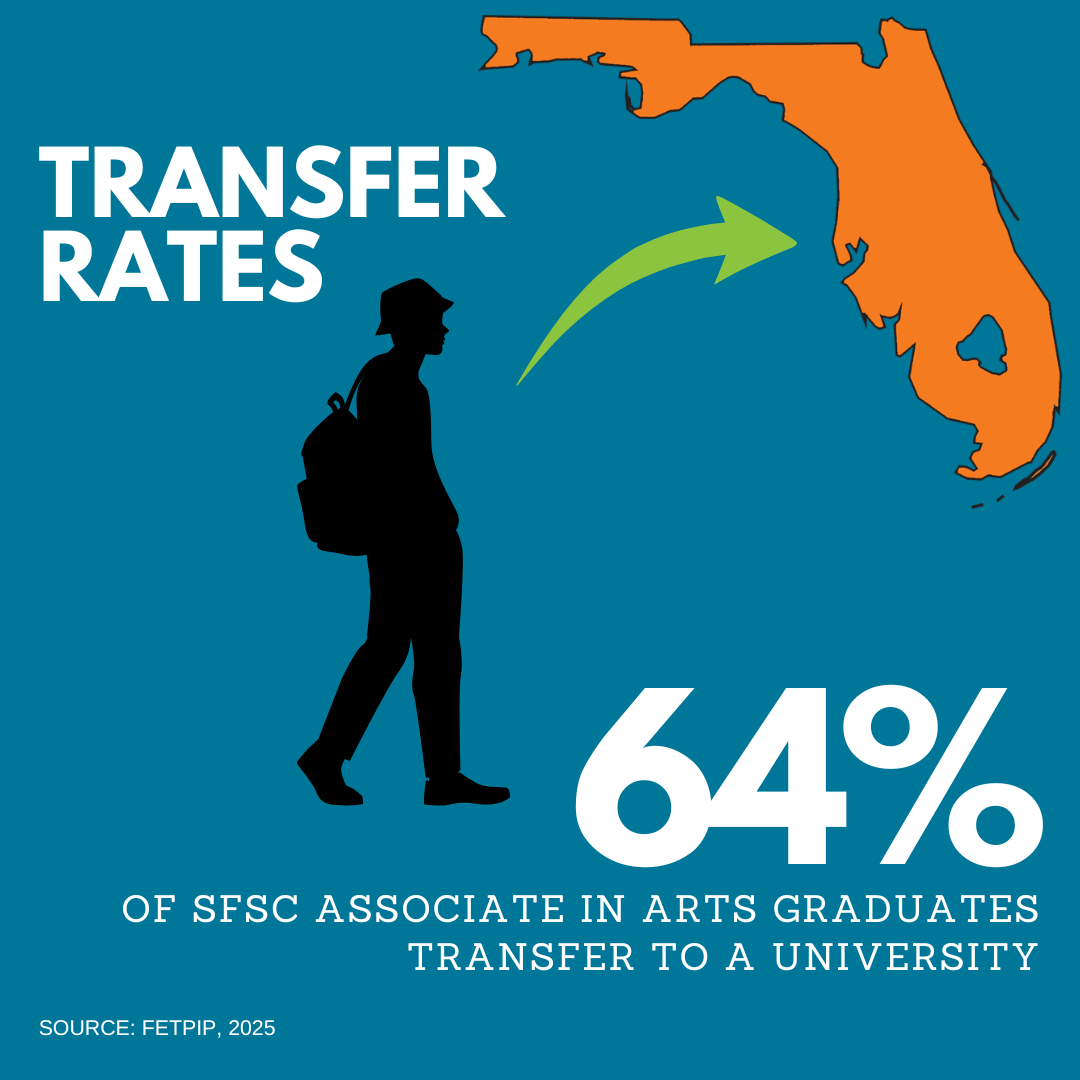
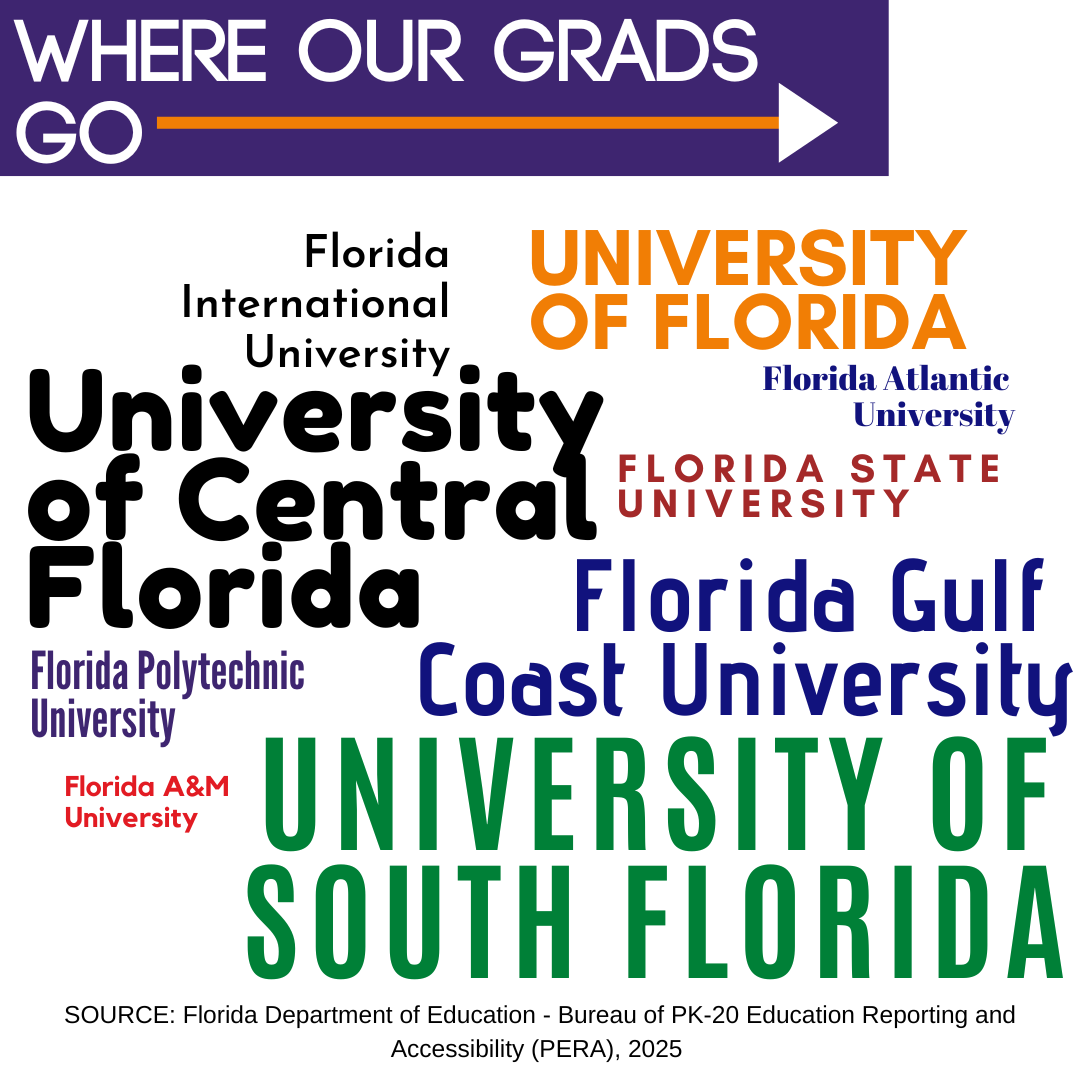
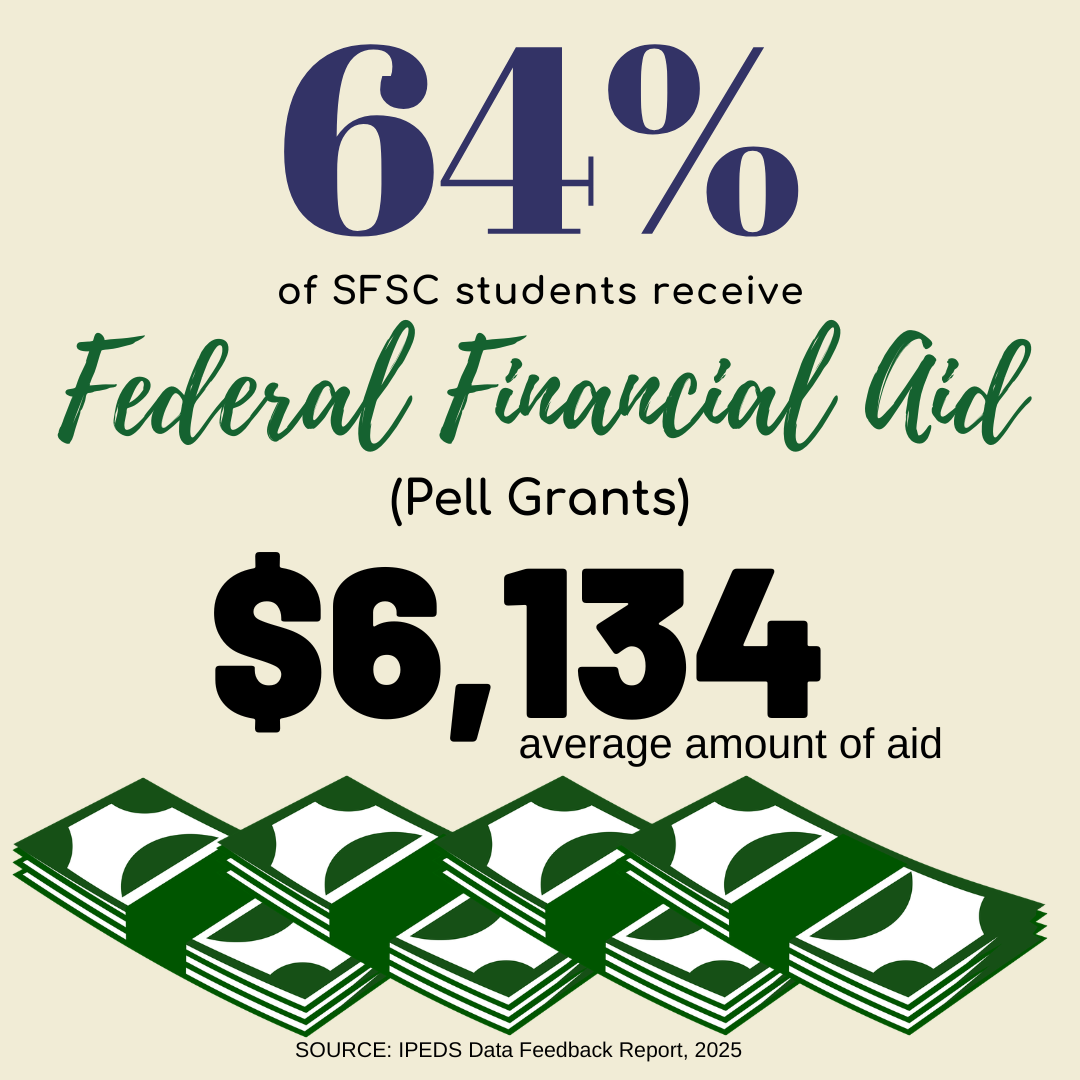
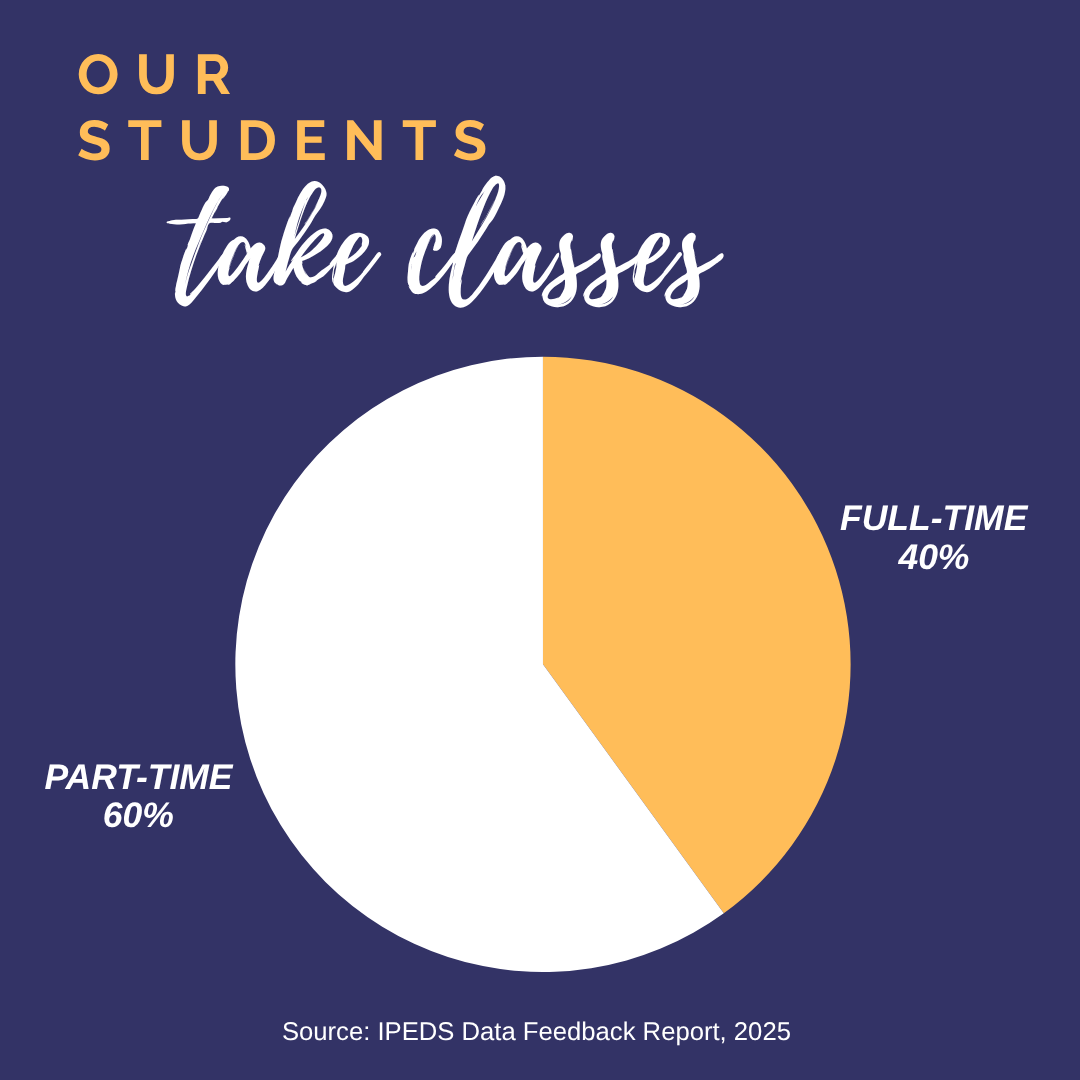
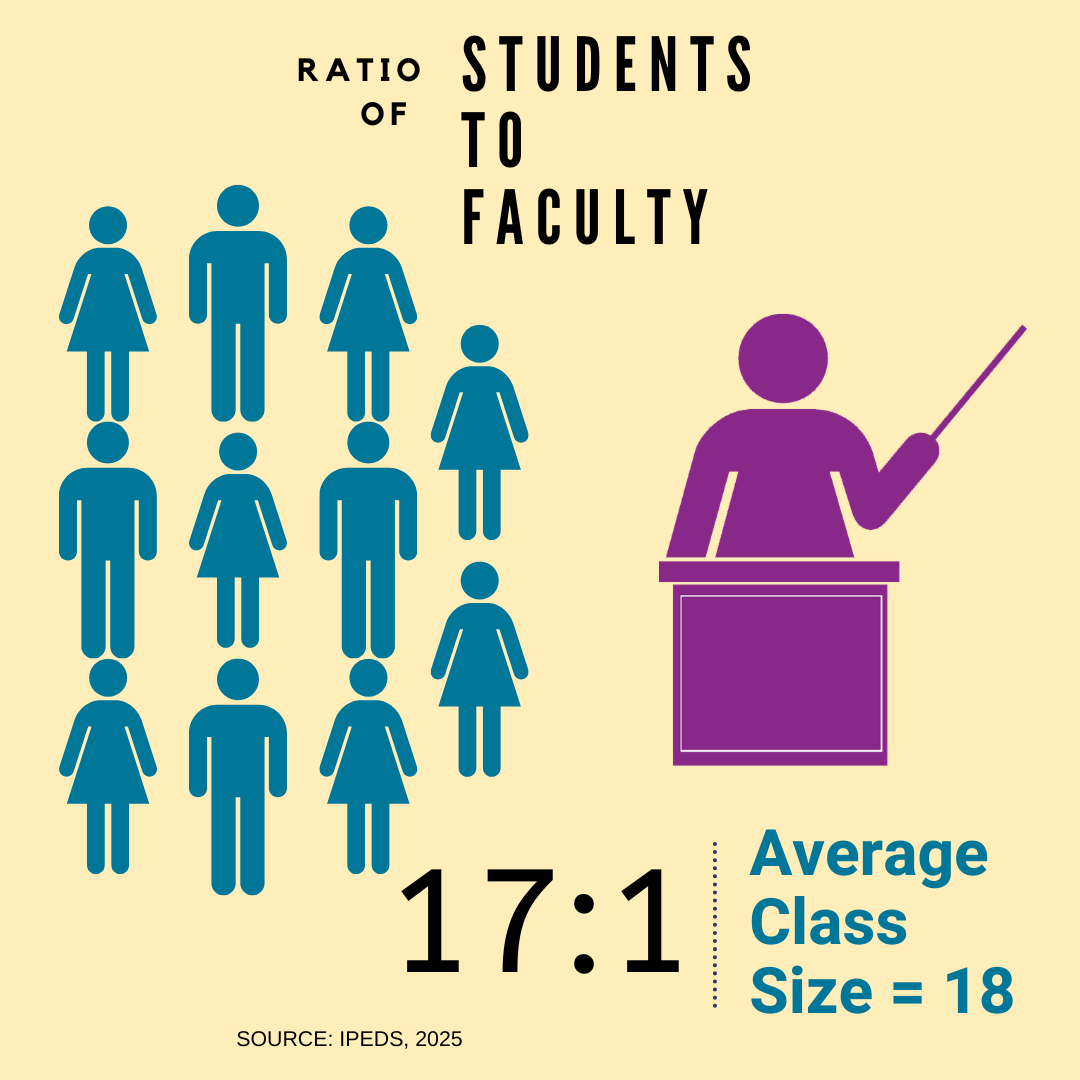
The infographics below depict the data that surrounds South Florida State College (SFSC). Each image links to the supporting source. The College’s Core Indicators of Effectiveness (CIE) can be viewed by visiting Student Achievement Data.

STUDENT DEMOGRAPHICS

Race and Ethnicity - White 44%; Hispanic 37%; Black 10%; Unknown/Did not report 5%; Asian 2%; Multiracial 2% 39.5% of SFSC students are the first in their families to attend college 38% of SFSC students receive federal financial aid, amounting to $4,190 per student

ON CAMPUS

35.5% of students attend full-time; 66.5% attend part-time The student to faculty ration is 11:1. Average class size is 17.Athletics at SFSC consists of 66 athletes with 40 female and 26 male.

STUDENT SUCCESS

19.75% of total credit sections are in distance learning 85% of SFSC students who took only courses passed with a grade of C or better Transfer Rates 56% of SFSC Associate in Arts Graduates transfer to a Florida universityOur graduates go to state universities throughout Florida.97.3% of graduates indicated that they met their educational goas at SFSC. South Florida State College is number 1 in the state for completion of a two year program with 41.5% for in two years, 58.5% for in three years, and 59.2% for in four years. Pass Rates 100% Cosmetology; 100% Corrections; 97% Practical Nursing; 95% Associate Degree in Nursing; 83% Radiography; 78% Law EnforcementGraduation Rates by Race